Firstly, review your visual ideas based on from the previous exercise through a process of critical evaluation. Which ideas are you drawn to? Which ideas have ‘legs’ – possible interesting outcomes which are worth pursuing? Often the ideas which are strongest are those which have depth, or many layers of association. Perhaps you are intuitively drawn to a particular idea. Select a few ideas you would like to push further. Use your learning log to record your thoughts.

The first two thumbnail sketches relate to the ‘dog ate my homework’ excuse. My first idea was to have a side on view of a dog in an anatomical style so that you could see homework sitting in its stomach. The second idea was to have a dog with a bone in its mouth that represented homework in some way. The next thumbnail sketch refers to the deception of ‘I’ve got your nose’ when somebody makes their thumb look like a nose grasped inside a hand. I thought the idea of having a hand grasping an actual nose would be very provocative but ultimately I wasn’t drawn to these ideas and felt they were a little too straightforward and conventional.
The next three thumbnails focused on deception. The first sketch would be a book titled ‘A Guide to Plants’ with a flowery illustration, when the book is opened it reveals a nuclear power plant. The third sketch was an attempt at compacting these elements into one illustration and so I created the idea of a nuclear power plant with flower like clouds being pumped out of it. This third sketch is one I feel is worth developing because of it being a neat little visual metaphor.
The next two thumbnails were a wizard and a witch. These were my most lazy thumbnails. The idea was that the wizard and witch both represented old age and trickery but beyond this I had nothing else to say and I don’t wish to develop these ideas any further.
The next two thumbnails focused on illusion. The idea was to have simple bauhaus shapes cut out on a front cover with colours filling them from the inside page. However, when you open to the next page you can see that the coloured shapes behind are very different. This idea is deceptively simple and something I would like to develop.
The rest of my thumbnails focused on the idea of the universe itself being the oldest trick in the book. I thought about how the universe seemingly came from nothing or a singularity and I mentally made a link to the ball inside a cup trick where a ball seemingly appears and disappears. This was my favourite idea. The first three thumbnails attempted to illustrate the ‘universe in a cup’ trick which I want to develop. The next two thumbnails show a small singularity and an exploding big bang next to each other. This idea seemed a little too simplistic. The last idea was to have a flip book that showed an expanding universe on the right side pages with infographics on the left side. I’m uncertain whether this is an overloaded idea. I may develop it further.
Now, do you need to undertake any research to help move your selected ideas on? The form your research will take depends on the individual elements of your idea. Find source material that helps informs your ideas. For example, by doing objective drawings or taking photographs, to understand your subject better, and to consider aspects of composition. You can use both primary and secondary sources of research in this way. Research feeds into the development of your visual work, informing and advancing your ideas. Document this phase of the work accordingly.
The developing your ideas stage is about building on your initial ideas by reworking them, adding the visual or other insights gathered through your research, and testing out different versions or possibilities. Spend 45 minutes developing the possibilities of one of your ideas. How many different ways can you visualise this?
If you want to develop a broader range of ideas, then repeat the previous exercise to generate more possibilities, potentially using a different phrase as a starting point. Use your learning log to document this process of review, research and development.
Visualising your ideas is the culmination of all your preliminary work in which you work up some more developed visual sketches and ideas. This artwork can be hand-drawn illustrations, photographs, and/or include typography. The presentation can be a little rough around the edges but should show the main elements of your designs. Select the strongest variation of your ideas from the previous research and development exercise to start exploring how you can visualise them within a mock-up.
Use your learning log to document these research and development stages, and to reflect on the process and your results.
The Deceptive Plant
The idea I call The Deceptive Plant was all about combining flowers with a nuclear power plant to illustrate the idea of deception. I thought my idea from the generating ideas stage was sufficiently clear and concise so my research here involved some visual aids so that I could work on a better illustration for the idea.
I surfed through Pexels for free stock images to use and found the some of the following that I liked:


With these visual references I created a more detailed sketch of my idea:

I think the idea to juxtapose two versions of the word plant as an illustration of deception is a smart one. However, this seems vaguely attached to the phrase ‘the oldest trick in the book’. Also, my illustration skills are weak and I’m not sure how much further I could take this idea in its current form.
Images from Pexels:
https://www.pexels.com/photo/nuclear-power-plant-3044473/
https://www.pexels.com/photo/landscape-photography-of-cooling-tower-162646/
https://www.pexels.com/photo/white-and-yellow-flower-with-green-stems-36764/
https://www.pexels.com/photo/nature-summer-purple-yellow-36753/
https://www.pexels.com/photo/yellow-colorful-white-flower-45901/
Bauhaus Illusion
My Bauhaus Illusion idea was all about opening a front cover with shape cut outs to reveal different shapes inside. The research I undertook involved brushing up on the Bauhaus style and in particular the colour and form theory proposed by Wassily Kandinsky. Kandinsky assigned primary colours to the three primary shapes of the Bauhaus (triange, circle and square) based on their perceived characteristics. For example, yellow was assigned to the triangle because the acute angles were seen as warm. Pointed angles were seen as warmer whereas blunted angles were colder in Kandinsky’s view. As the circle has no angles it was classified as cold (blue). The square being somewhere between the circle and triangle in terms of shape was assigned red (as a medium to yellow and blue).
Although this was based on Kandinsky’s subjective feelings a questionnaire was used at the Bauhaus and provided confirmation of these assignments. There may not be a scientific backing here but the colour-shape associations have proven to be iconic.

The typeface Futura is often associated with the Bauhaus. Futura was designed by Paul Renner who shared many of the ideals of the Bauhaus. Futura is based on simple geometric shapes and is a typeface that rejects the past in favour of modernity.
With this in mind I have created a Bauhaus influenced take on my cut out idea:


This idea seems a little more relevant to the ‘oldest trick in the book’. It was fun to take a more tactile path with this idea and create something more ‘physical’ and interactive.
The Big Bang
My favourite idea to attach to ‘the oldest trick in the book’ is still the big bang theory. It is quite literally the oldest trick (something out of ‘nothing’) in the totality of existence! I thought the universe in a cup idea I had was still very powerful but I wanted to focus on developing a spread from the flip book I imagined. I began by looking at some infographics for the big bang and found some of the following:


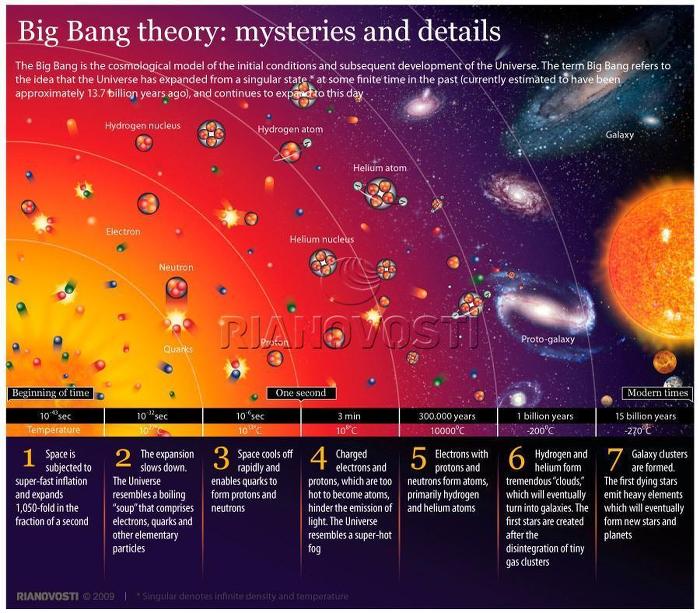

The ones I liked the most were the more minimal and simpler designs. I thought with my other two ideas being hand-drawn and crafted that this was a good chance to create something digitally. This would also suit the more minimal approach I aimed to take. I also spent a little bit more time researching the big bang timeline itself and realised how little I knew before!

What I ended up creating was something along the lines of the Swiss school, with simple illustrations and a clear modern design and typeface. The bigger idea is for the circle to change as you flip through the book to illustrate the evolution of the big bang with the left spread reserved for information.
I enjoyed developing these ideas to varying degrees. I guess I feel happiest with Big Bang development the most. This is probably because I’m more comfortable working on the computer with a program like InDesign. It isn’t just this but also that I believe this is the strongest idea.
References
notes on design. 2016. Type in History: Futura. [ONLINE] Available at: https://www.sessions.edu/notes-on-design/type-in-history-futura/. [Accessed 17 March 2020].
documenta archiv. 2020. Primary colors and shapes at the Bauhaus. [ONLINE] Available at: https://www.documenta-bauhaus.de/en/narrative/476/primary-colors-and-shapes-at-the-bauhaus. [Accessed 17 March 2020].
EarthHow. 2019. The History of the Universe: The Big Bang and Beyond [Infographic]. [ONLINE] Available at: https://earthhow.com/history-of-the-universe/. [Accessed 17 March 2020].
Planck Mission. 2020. Timeline of the Universe. [ONLINE] Available at: http://planck.cf.ac.uk/science/timeline/universe/bigbang. [Accessed 17 March 2020].
SIDHARTH NIKAM, (2020), The Big Bang and expansion of the universe [ONLINE]. Available at: https://www.jpl.nasa.gov/infographics/infographic.view.php?id=10824 [Accessed 17 March 2020].
JPLPublic, (2020), The Story of Our Universe [ONLINE]. Available at: https://www.jpl.nasa.gov/infographics/infographic.view.php?id=11147 [Accessed 17 March 2020].
Josh Elkin, (2020), The Big Bang [ONLINE]. Available at: https://infograph.venngage.com/p/166146/the-big-bang [Accessed 17 March 2020].
RIANOVOSTI, (2009), Big bang theory: mysteries and details [ONLINE]. Available at: https://sputniknews.com/infographics/20091027156603206/ [Accessed 17 March 2020].
VectorMine, (2020), Big Bang Theory [ONLINE]. Available at: https://www.dreamstime.com/big-bang-theory-vector-illustration-infographic-universe-time-size-scale-diagram-development-stages-first-particles-image112764179 [Accessed 17 March 2020].

1 comment